The Path Predictor charts may seem complex at first, but given their strong performance since launching in June 2023, I wanted to break down how to read and use them effectively.
A typical Path Predictor chart includes several key elements beyond just the price candles of the security being analyzed:
1. Moving Averages (Red & Black Lines)
- The chart typically includes 50-day and 200-day simple moving averages (SMA), as these are widely followed by traders.
- Moving averages serve as support when price is above and resistance when price is below.
How to Use Moving Averages for Trading
- If price is above a moving average, it can act as support.
- Example: If price declines toward the moving average, a trader may exit short positions or enter long positions, anticipating a bounce.
- If price is below a moving average, it can act as resistance.
- Example: If price rises toward the moving average, a trader may exit long positions or enter short positions, expecting resistance and a potential reversal.
2. Pivot Points (Blue Horizontal Lines)
- These levels are calculated using a proprietary program that factors in price action and volume.
- Like moving averages, pivot points act as support when price is falling and resistance when price is rising.
3. Pivot Boxes (Blue Bordered Box with Yellow Inside)
- Pivot Boxes function similarly to pivot points but provide a broader range of price confluence rather than a single level.
- They often represent stronger support or resistance zones due to multiple levels of influence.
- Traders may look to enter or exit positions depending on how price interacts with these boxes.
4. Path Predictor Pattern (Orange Lines)
- The orange lines represent the calculated expected path of a financial instrument, including:
- Price targets
- Expected timeframes for movement
- These patterns are generated based on dozens of technical and statistical variables within the proprietary system.
Understanding Probability in Path Predictor
Each Path Predictor pattern includes calculated probabilities for different outcomes.
For example, in the chart below:
- 66% probability of the first orange path playing out
- 22% probability of a sideways move
- 12% probability of an upward move
A probability below 65% does not mean the pattern is invalid—just that the system has lower confidence due to conflicting technical signals.
As price moves forward, Path Predictor will update probabilities at critical decision points (e.g., intersections of orange lines), which are shared with FMA subscribers.
How to Use Path Predictor for Trading
⚠ Always consult a licensed financial advisor before making any trades.
There are countless ways traders can utilize Path Predictor in their analysis. Here’s an example:
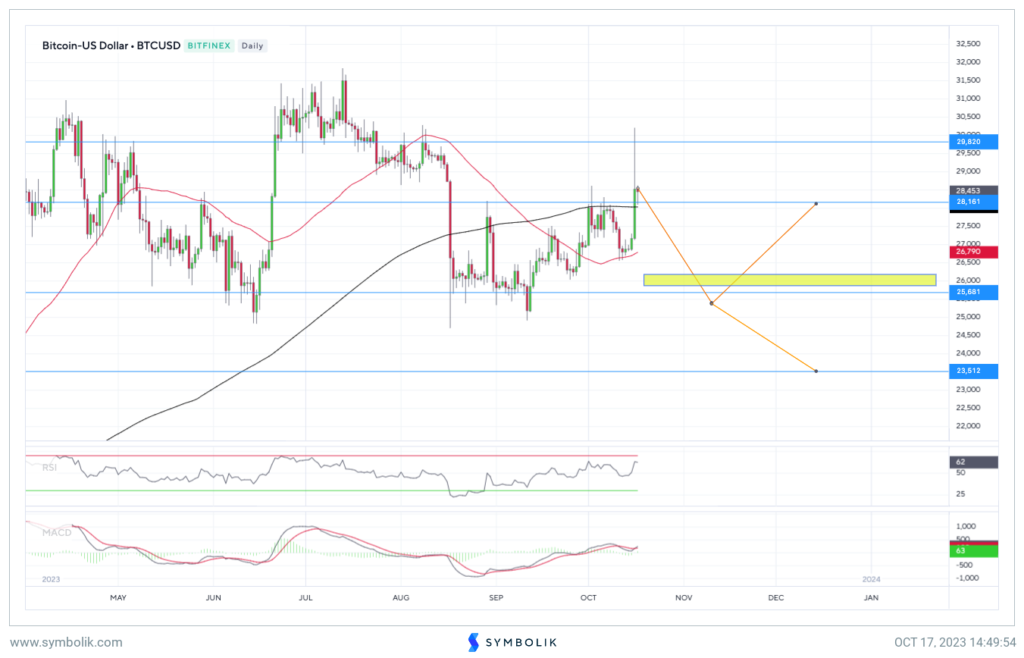
Example: Shorting Bitcoin Using Path Predictor
- A trader sees a bearish pattern on Path Predictor and considers shorting Bitcoin.
- The key concern is whether the price pivot at $28,161 will act as support.
- The trader may wait for a break below $28,161 before entering the short position.
- A close above $28,161 could be used as a stop loss.
- If the trade is entered, the likely exit target is the pivot box at $26,250, which is expected to provide support.
Final Thoughts
The Path Predictor charts help traders identify support and resistance levels through a combination of:
✔ Pivot Points
✔ Pivot Boxes
✔ Moving Averages
✔ Path Predictor Patterns
Advanced traders can use these charts to develop both short-term and long-term trade ideas, refining their strategies based on technical confluence and probability-driven insights.
Would love to hear how you’re using Path Predictor in your own trading strategies!
CLICK THIS LINK FOR A LARGER VIEW OF THE CHART BELOW: https://sblk.io/s/lMMzuQUAFLtnQuOv
FINANCIAL CONTENT DISCLAIMER –
The Sharp Plays, @TheSharpPlays on Twitter, TheSharpPlays.com, and this Web Site (collectively referred to hereafter as “TSP”), is published as an information service and it includes opinions as to buying, selling and holding various stocks, investments, and other securities. However, the publishers of TSP are not brokers or investment advisers, and they do not provide investment advice or recommendations directed to any particular subscriber or in the view of the particular circumstances of any particular person. The information provided by TSP is obtained from sources believed to be reliable but is not guaranteed as to accuracy or completeness. Visitors to TSP or any other persons who buy, sell or hold securities should do so with caution and consult with a broker or investment adviser before doing so.
At various times, the publishers and employees of TSP may own, buy or sell the securities discussed for purposes of investment or trading. TSP and its publishers, owners and agents, are not liable for any losses or damages, monetary or otherwise, that result from the content of TSP. Securities discussed by TSP should be considered speculative and contain a high degree of volatility and risk.
Trading securities and options involves risk. Prior to buying or selling an option, an investor must receive a copy of Characteristics and Risks of Standardized Options. Futures traders must review a copy of the Risk Disclosure Statement for Futures Contracts. Investors need a broker to trade securities & options and must meet suitability requirements. Past results are not necessarily indicative of future performance. Performance figures are based on actual recommendations made by TSP. Due to the time critical nature of stock, options, future, or other trading, brokerage fees, and the activity of other subscribers, TSP cannot guarantee that subscribers will mirror the performance stated on our track records or promotions. Performance numbers shown are based on trades subscribers could enter based on our guidelines.
The results posted for TSP are hypothetical. Results are based on the price when the position was published by TSP, and the price when dropped by TSP. TSP cannot guarantee that any person bought or sold the actual security for the prices listed on the Web Site. Investors may receive greater or lesser returns based on their trading experience and market price fluctuations. The prices listed are for reference only and are in no way intended to represent an actual trade, entry price or exit price.
The information contained on TSP is provided for general informational purposes, as a convenience to the visitors & subscribers of TSP. The materials are not a substitute for obtaining professional advice from a qualified person, firm or corporation. Consult the appropriate professional advisor for more complete and current information. TSP is not engaged in rendering any legal or professional services by placing these general informational materials on TSP. TSP and its publishers specifically disclaim any liability, whether based in contract, tort, strict liability or otherwise, for any direct, indirect, incidental, consequential, or special damages arising out of or in any way connected with access to or use of TSP, even if TSP has been advised of the possibility of such damages, including liability in connection with mistakes or omissions in, or delays in transmission of, information to or from the user, interruptions in telecommunications connections to the site or viruses.
TSP makes no representations or warranties about the accuracy or completeness of the information contained on this website. Any links provided to other server sites are offered as a matter of convenience and in no way are meant to imply that TSP endorses, sponsors, promotes or is affiliated with the owners of or participants in those sites, or endorses any information contained on those sites, unless expressly stated. TSP is the copyright owner of all text and graphics contained on this website, except as otherwise indicated. Other parties’ trademarks and service marks that may be referred to herein are the property of their respective owners. You may print a copy of the information contained herein for your personal use only, but you may not reproduce or distribute the text or graphics to others or substantially copy the information on your own server, or link to this website, without prior written permission of TSP. Permission to use and reproduce documents and related graphics available from this website is granted, provided that: (1) the below copyright notice appears in all copies and that both the copyright and this permission notice appear; (2) use and reproduction of documents and related graphics available from this website is limited to personal, non-commercial use; (3) no documents or related graphics, including logos, available from this website are modified in any way; and (4) no graphics, including logos, available from this website are used separate from accompanying text. Use or reproduction for any other purpose is expressly prohibited by law and may result in civil and criminal penalties. Violators will be prosecuted to the maximum extent possible.
OTHER THAN AS SET FORTH ABOVE, ANY REDISTRIBUTION of TSP reporting, TSP website content, or the information contained therein, without the written consent of the publishers of TSP, is STRICTLY PROHIBITED. Copying and/or electronic transmission of TSP content or TSP Web Site content is a violation of copyright law.